🔁 How Overhead Distribution Works in the P&L Report
Overhead Distribution is a feature that automatically allocates overhead costs across projects, allowing you to see their actual impact on each project’s profitability.
🔹 What are overhead costs?
Overhead costs are expenses that cannot be directly attributed to a specific project but affect the business as a whole. Examples include:
• Office rent
• Administrative staff salaries
• Accounting services
• Insurance
🛠 How to Configure Overhead Distribution
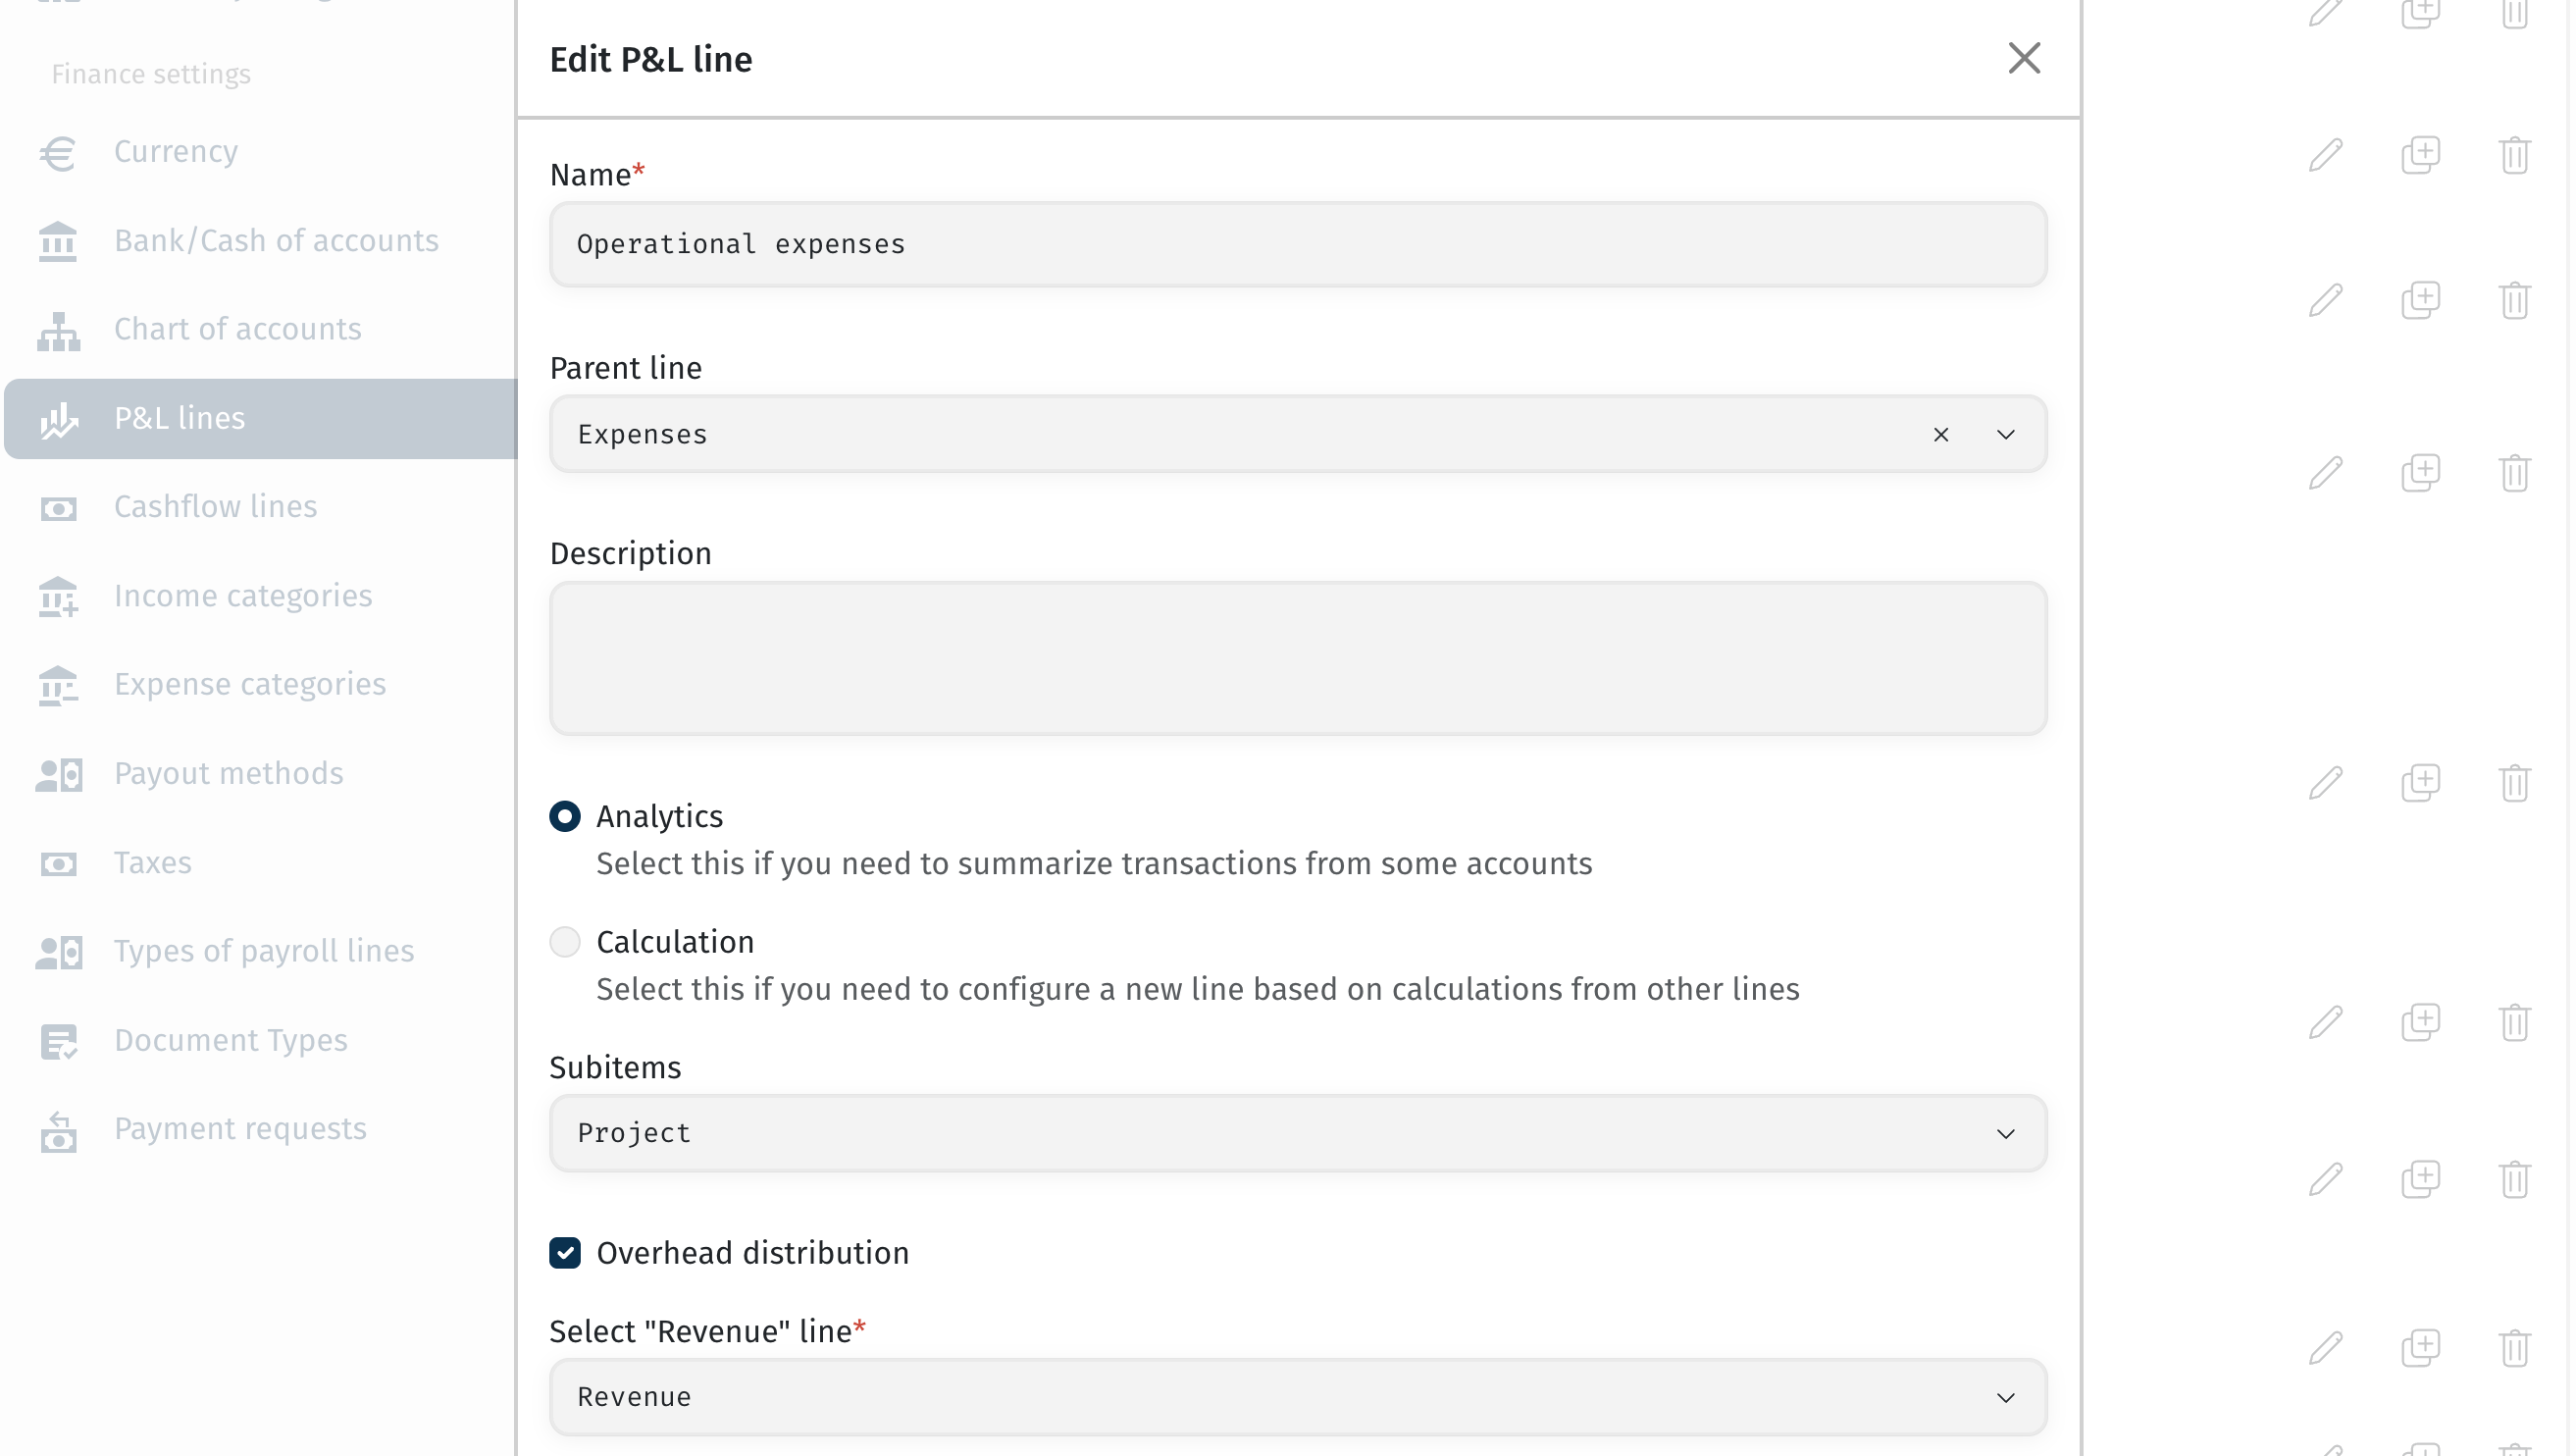
1) In the expense line that you want to allocate, enable the Overhead Distribution option.
2) Select an allocation basis, such as Revenue.
3) Save the changes and regenerate the P&L Report.
📊 Calculation Example
Let’s assume the following data:
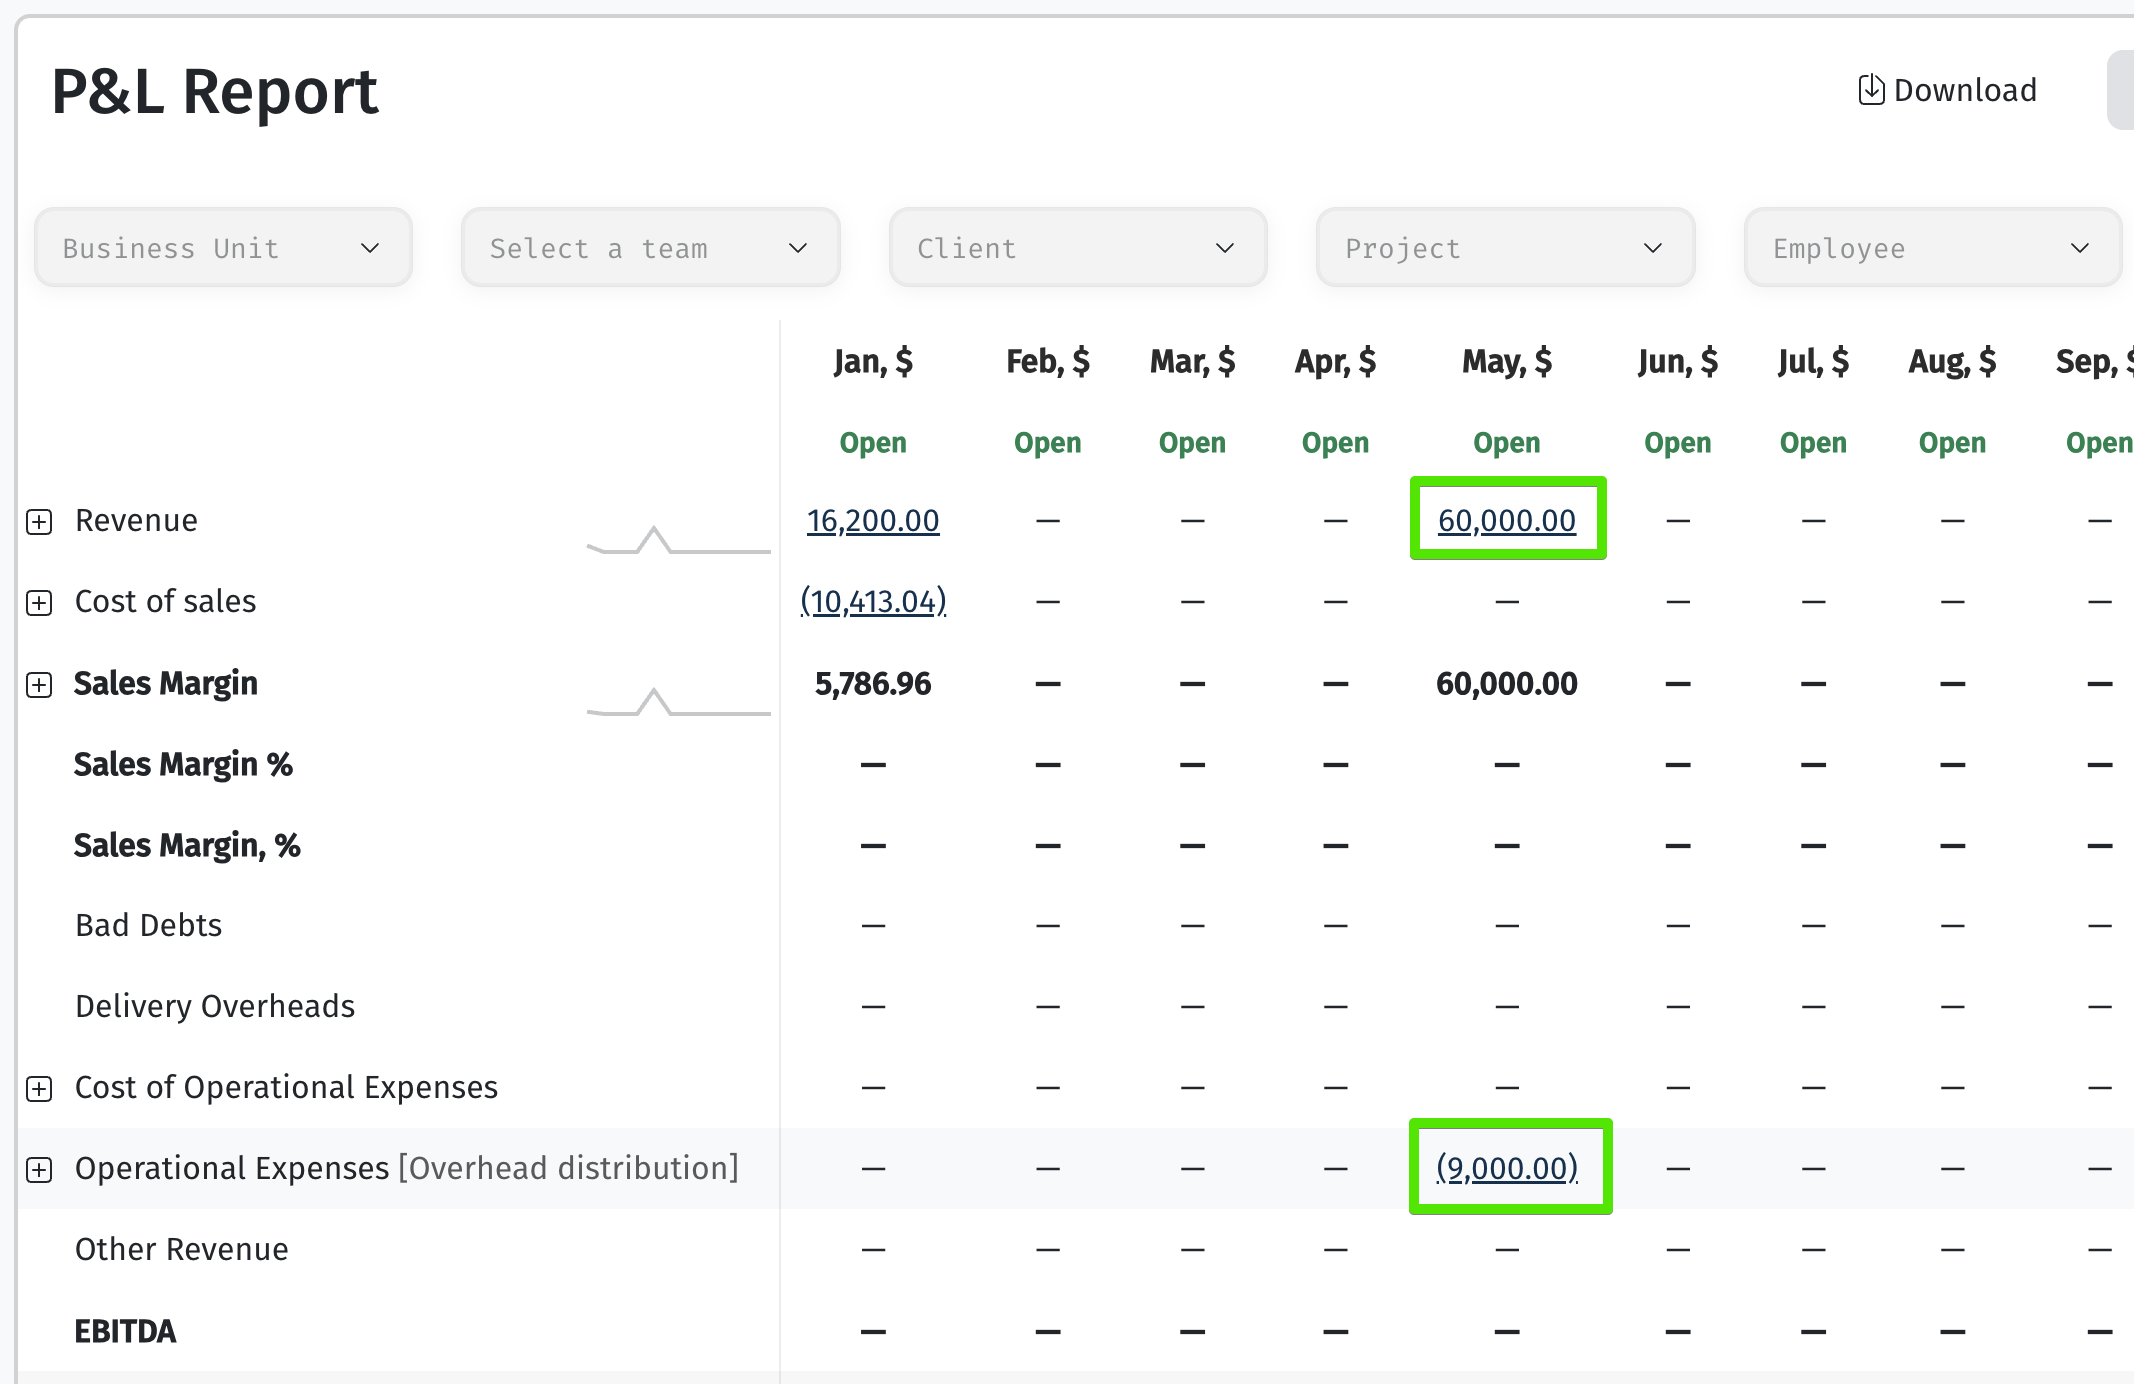
Total overhead costs to be allocated: $9,000
Projects and their revenue:
• Project A: $10,000
• Project B: $20,000
• Project C: $30,000
🔢 Step 1: Calculate Total Revenue
Total Revenue = $10,000 + $20,000 + $30,000 = $60,000
🔢 Step 2: Calculate Each Project’s Share
• Project A: $10,000 / $60,000 = 16.67%
• Project B: $20,000 / $60,000 = 33.33%
• Project C: $30,000 / $60,000 = 50.00%
🔢 Step 3: Allocate the Overhead Costs
• Project A: $9,000 × 16.67% = $1,500
• Project B: $9,000 × 33.33% = $3,000
• Project C: $9,000 × 50.00% = $4,500
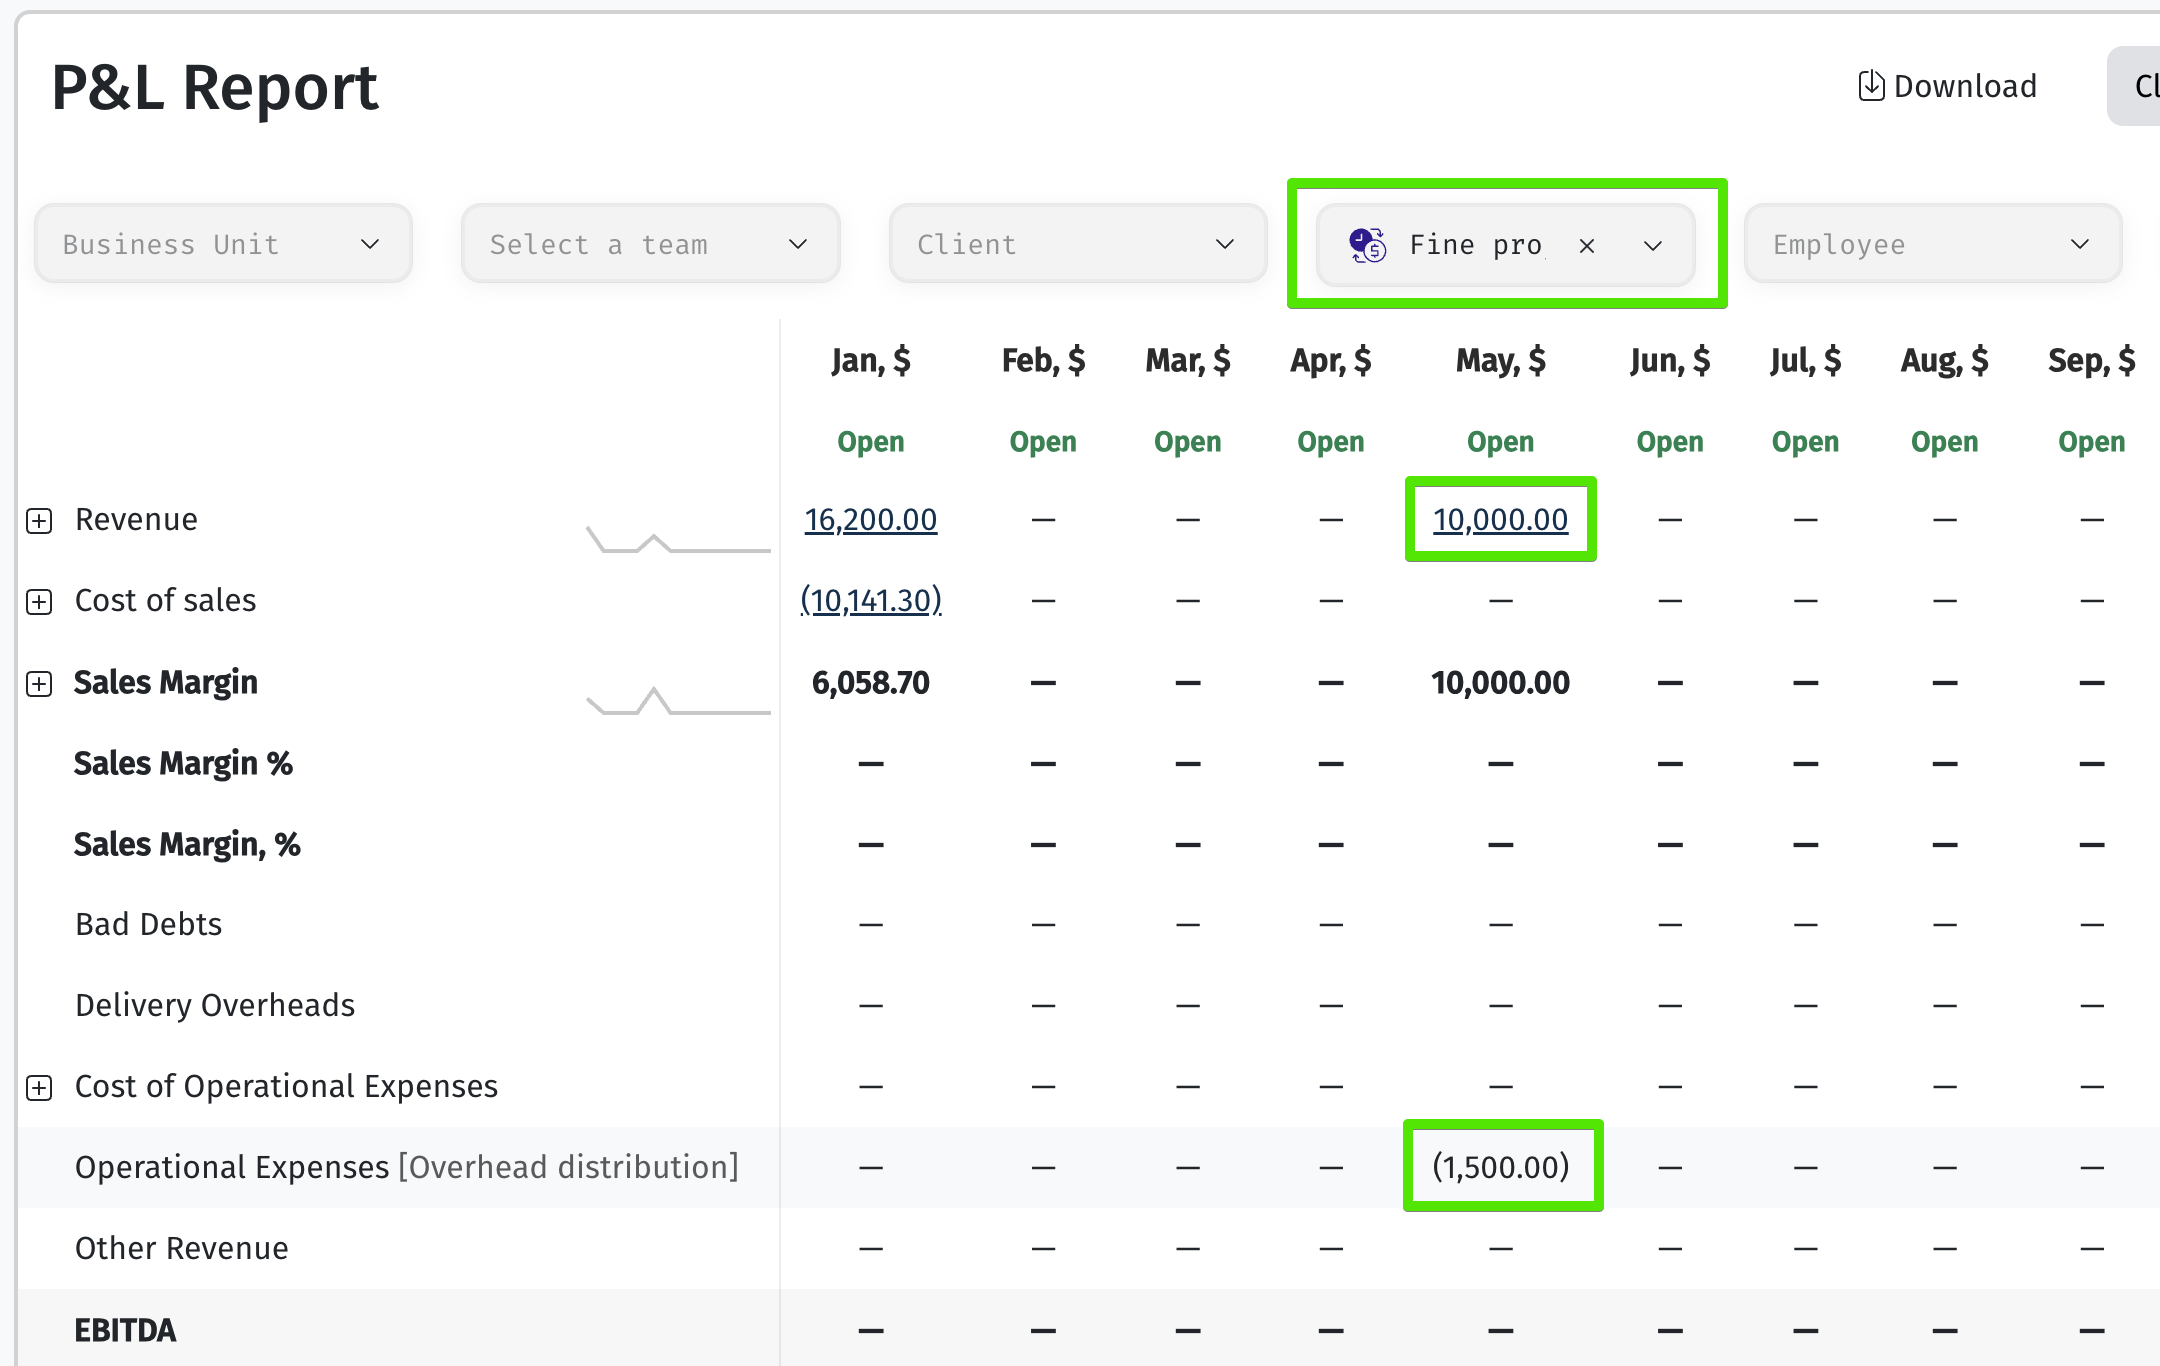
These amounts will appear in the Overhead Distribution line of the P&L Report when filtering by each respective project.
🔍 How Filters Work in the Report
• If no filters are applied, the Overhead Distribution line displays the full overhead amount.
• If you filter the report by a specific project, the system displays only the portion of the overhead allocated to that project.