This section of the system is designed for company resource planning. The schedule provides a clear overview of when a project is nearing completion and which resources will be freed as a result. It also shows which employees can be fully or partially allocated to other projects.
Interface Overview
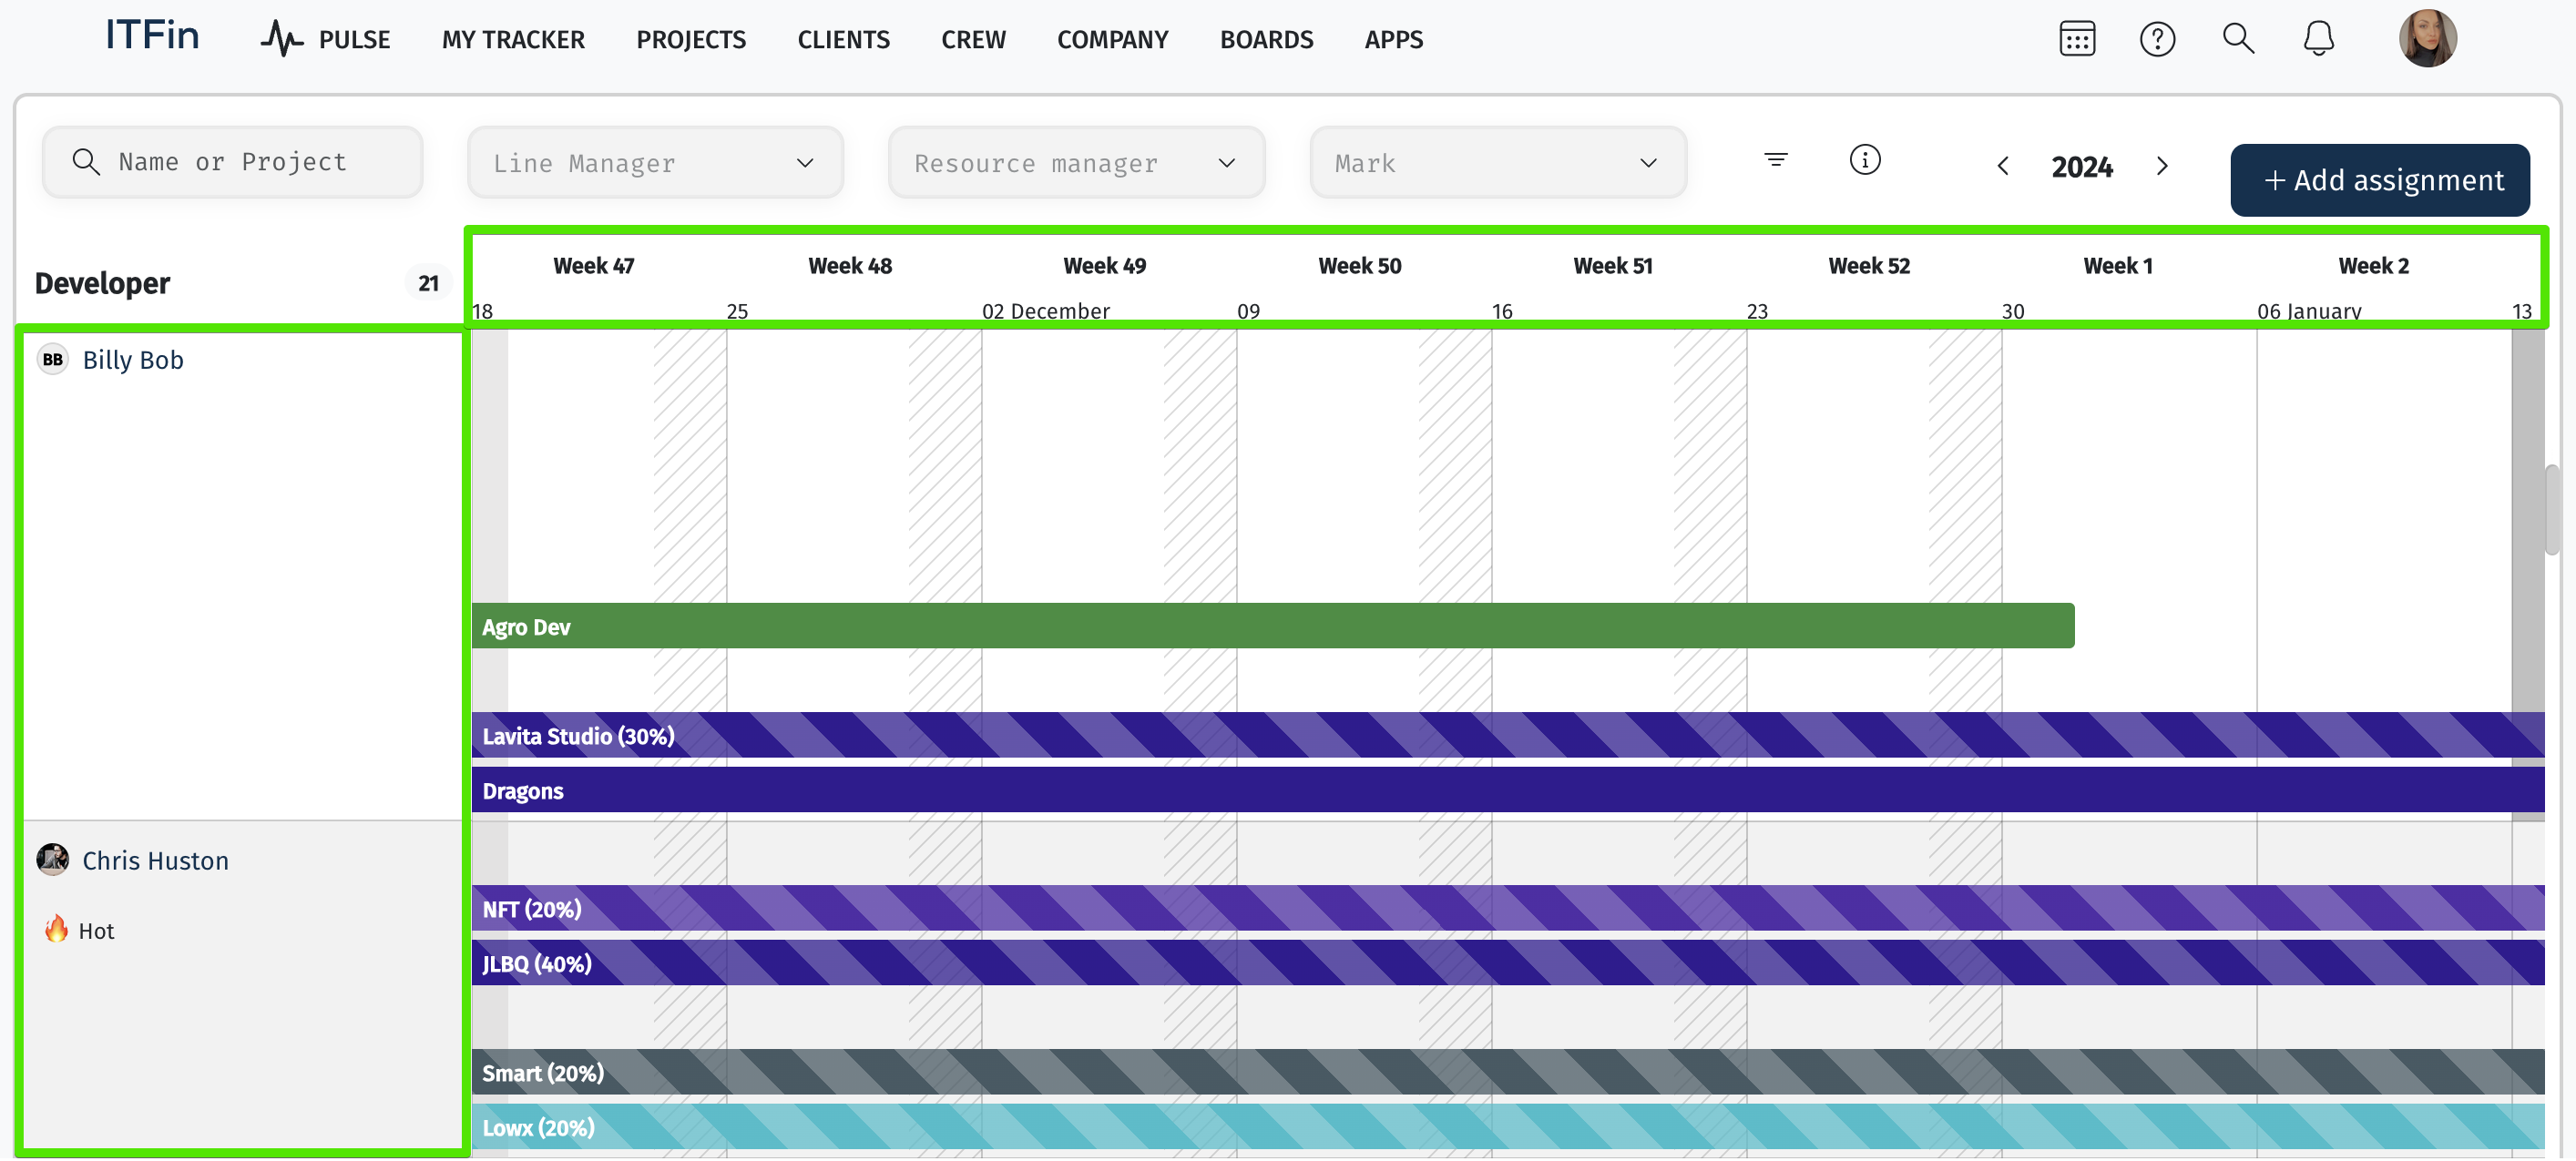
The page is presented as a calendar-style chart. Vertically, it displays a list of employees, while horizontally, it shows workweeks (or days).

The project timeline on the page is represented by a horizontal line. The color of this line is determined by the project type:
• Gray - Non-Profit
• Green - Fixed Price
• Blue - Time & Material
The page displays employee workloads, the projects they are involved in, their percentage of involvement, as well as vacation and sick leave periods. The vacation period is shown as a vertical orange stripe, while the sick leave period is shown as a vertical blue stripe. The current day is highlighted in gray.
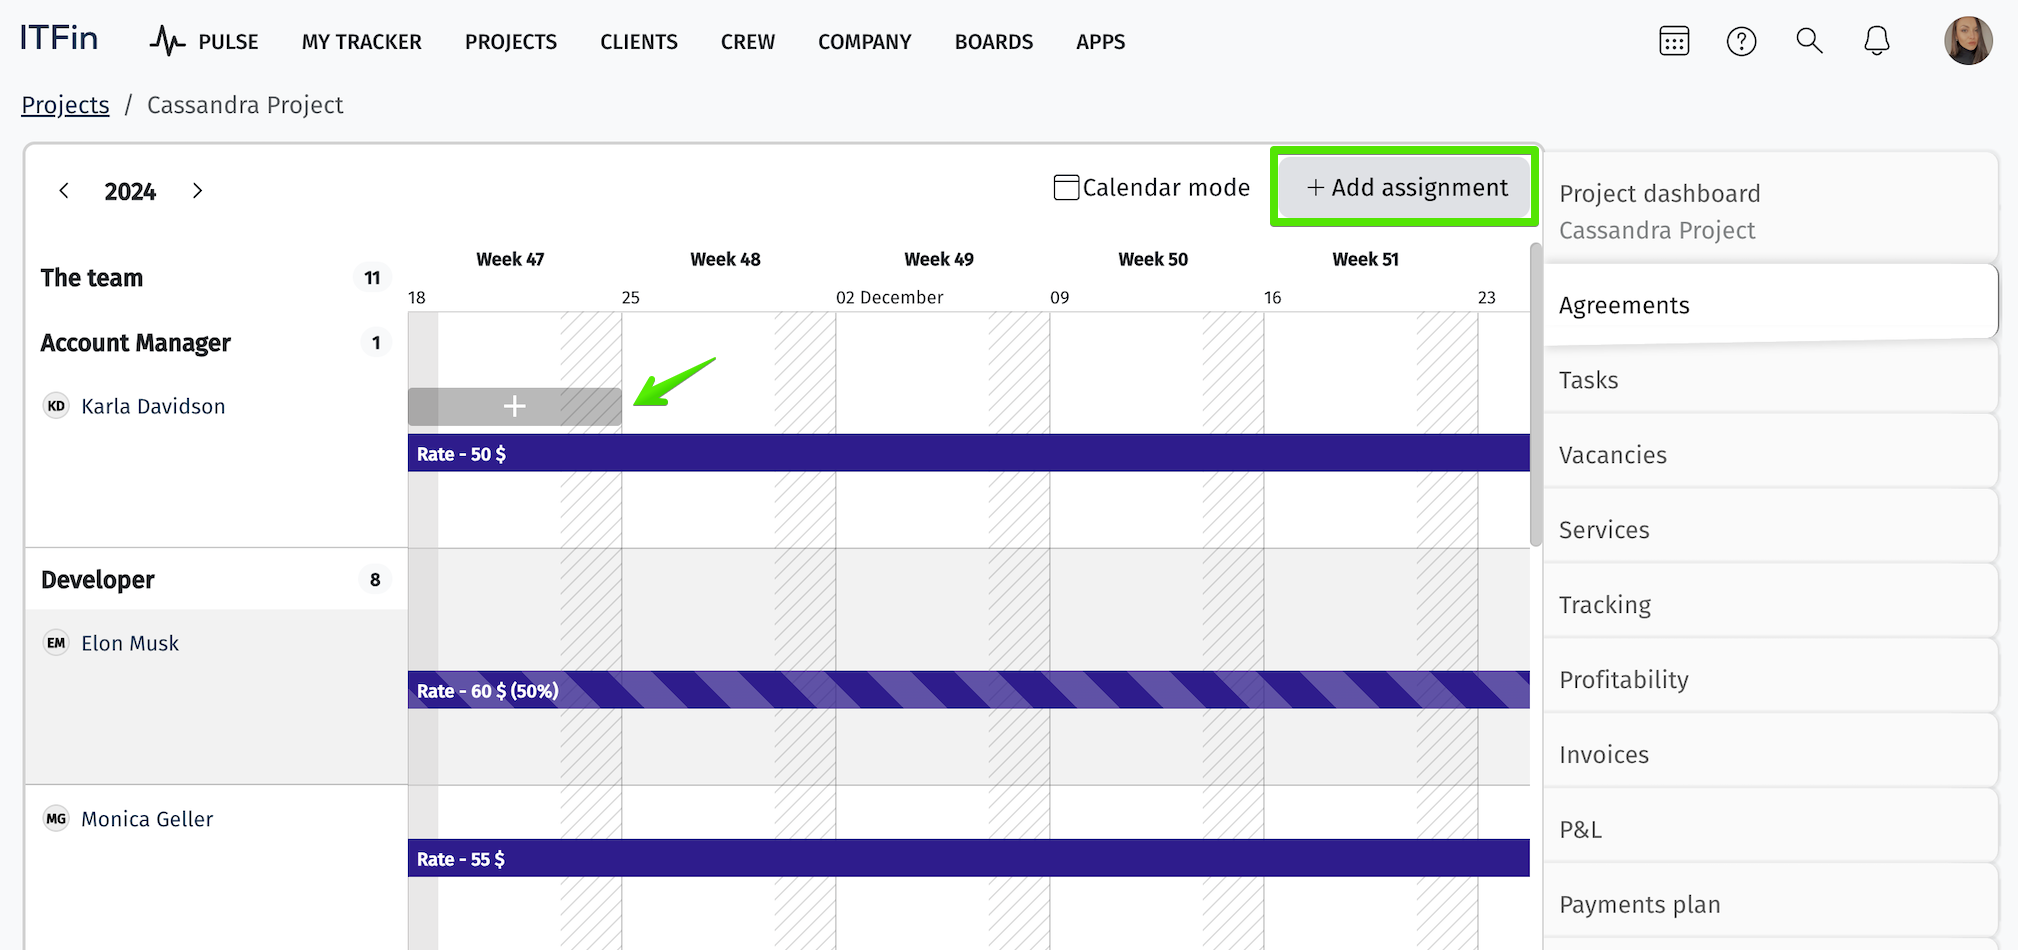
If you need to extend an employee’s involvement in a project, you can drag the project’s horizontal line to the right. To add an employee to a new project, use the +Add assignment option or click + in the employee’s row.

The system allows filtering by line manager, tags, or using a free-text search field to look up projects or skills specified in an employee’s profile.
Marks
In this section, you can add additional marks next to each employee to enable filtering based on them. We recommend agreeing at the company level on which tags to use in specific cases.
Scope:
Example of tag usage:
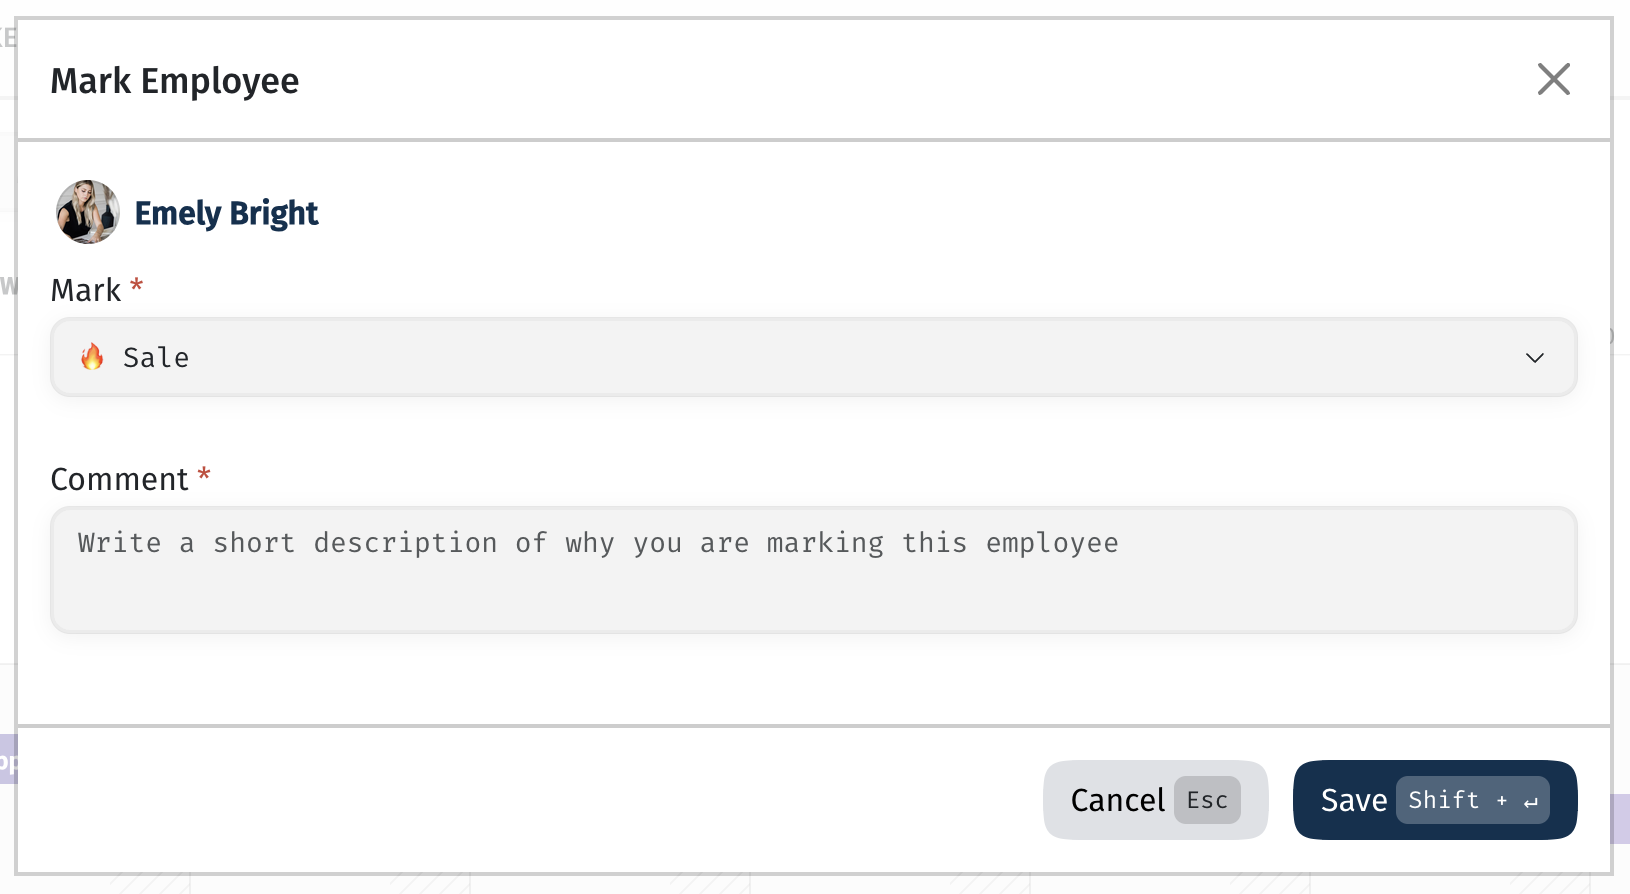
To add a mark, hover the cursor over the icon and click on it. A modal window will open, where the user needs to select a mark from the dropdown list, and below in the Comment field, add a description, which will also be displayed.

Resource utilization report
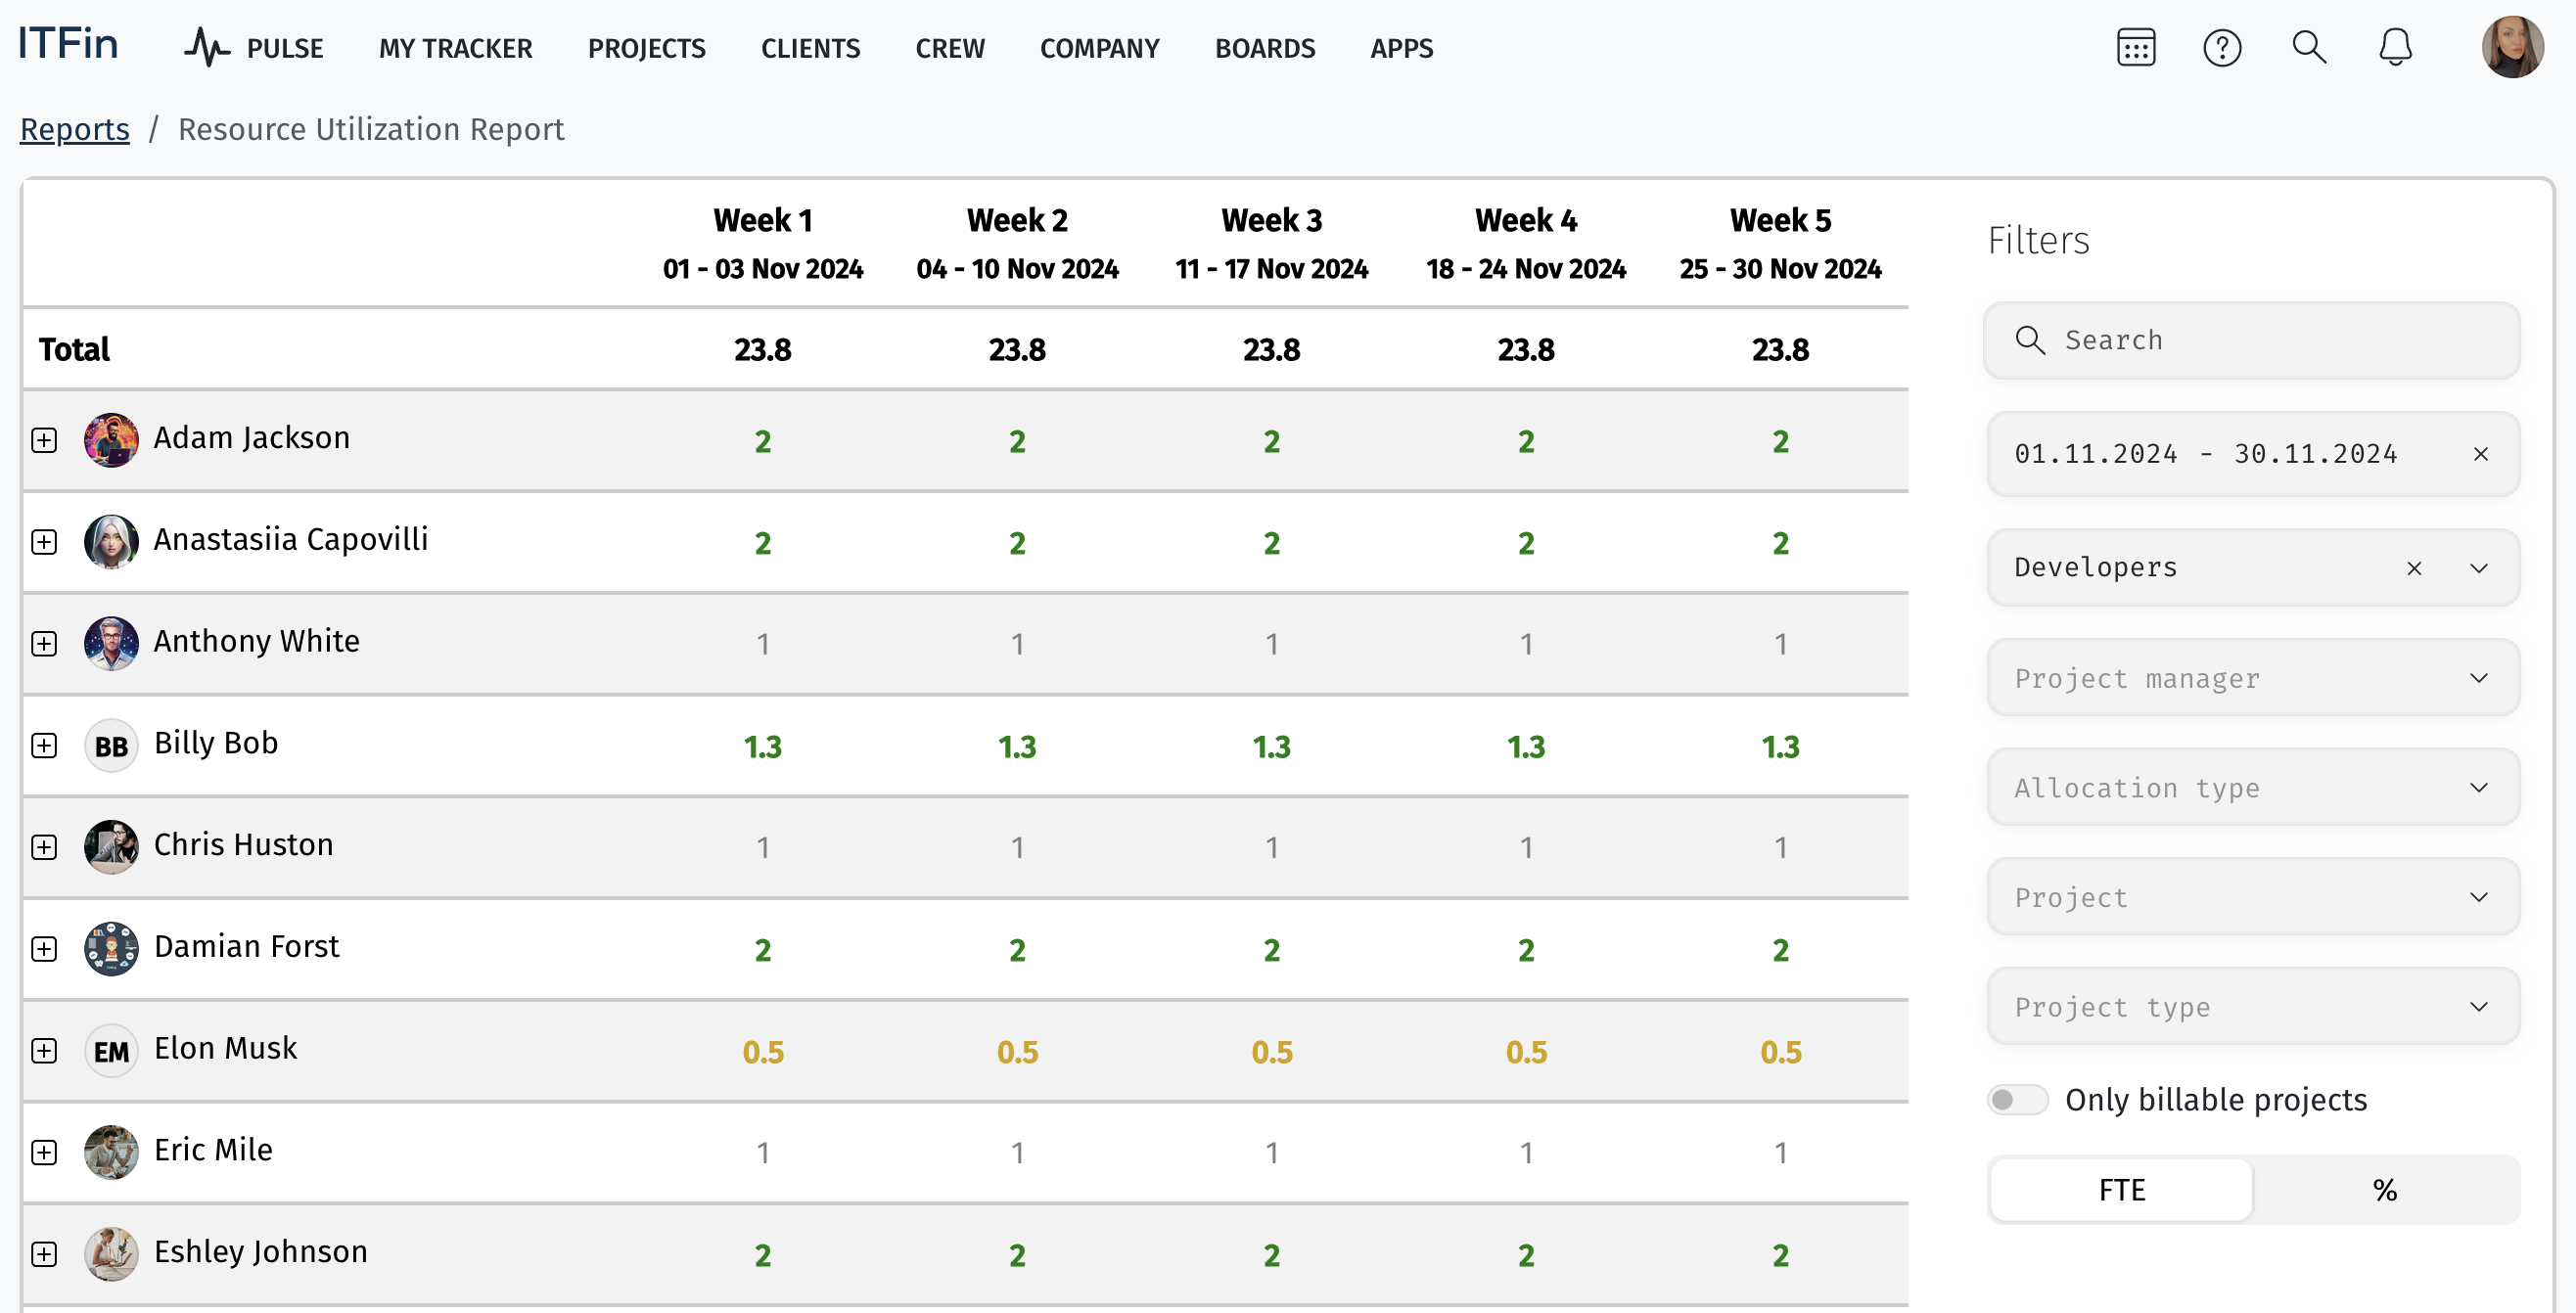
Information about the workload of employees can also be viewed in a table format on the Utilization tab.

The data in the report is based on the specified allocation of employees across projects where they have agreements.